

ReliaSoft BlockSim - Event Analysis Module
Probabilistic event and risk analysis
RBDs, fault trees, and Markov diagrams
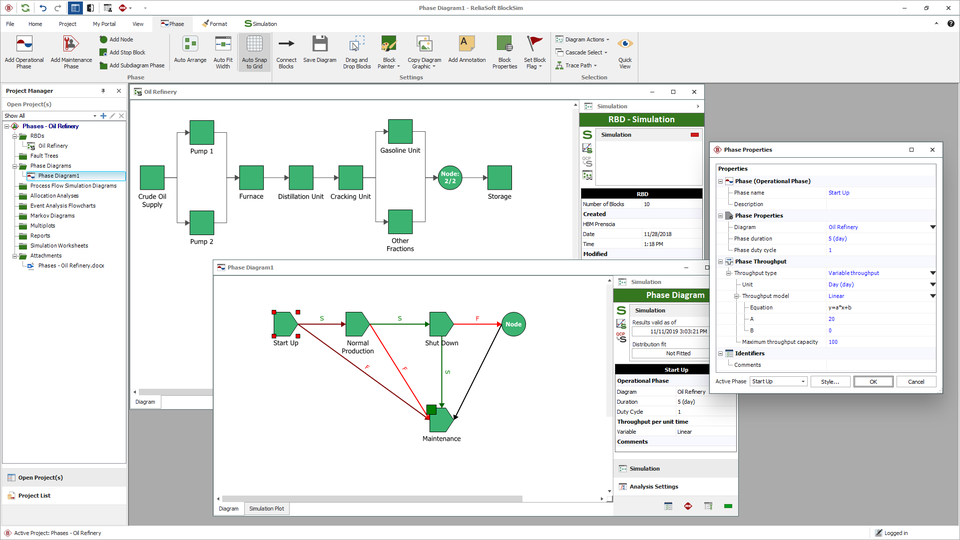
ReliaSoft BlockSim provides a comprehensive platform for system reliability, availability, maintainability and related analyses that allows you to model the most complex systems and processes using reliability block diagrams (RBDs), fault tree analysis (FTA), or Markov diagrams. Using exact computations or discrete event simulation, BlockSim facilitates a wide variety of analyses for both repairable and non-repairable systems.
The software also now contains optionally licensed features for Process Flow and Event Analysis (formerly known as RENO).
Discover Event Analysis capabilities that will make your work easier
Develop ideas, workflows and estimate results of interest
Build graphical models for the scenarios that you are trying to understand, quantify, and/or simulate — all with a familiar and intuitive flowcharting concept.
Track real-time values to generate desired results
Watch the results' progress over time or see how your results vary during sensitivity analysis.
Evaluate how key inputs will affect the results
Examine equipment’s behavior over time with reliability or availability results. Easily change variables across analyses/simulation runs with sensitivity analysis.
Design and build your own analyses
Comfortably build analyses with the Event Analysis module's familiar flowcharting concept. Enjoy the flexibility of a computer language without having to write any code.
Automatically estimate optimum values
Maximize profits or minimize costs with multiple simulation runs to determine the optimum amount of inventory or the optimum preventive maintenance (PM) interval.
Apply insights to a wide variety of applications
Use results and metrics from the module for various applications, such as risk and safety analysis, complex reliability modeling, decision making, maintenance planning, optimization, etc.
See All Functionalities
Flowchart models
Use a familiar and intuitive flowcharting concept to build graphical models for the scenarios that you are trying to understand, quantify and/or simulate. Employ easy point-and-click techniques to create flowcharts from blocks, gates and other resources that are already defined in the project — and easily define new modeling elements as your flowchart evolves.
Flexible array of building blocks
An extensive and flexible selection of building blocks to serve different functions within the flowchart model. Some of the most used modeling features include the ability to:
- Use variables to store numerical values.
- Build simple or complex equations for a wide variety of purposes.
- Check incoming values against one or more conditions in order to trigger various responses. This includes "if statements" with true/false outcomes for single or multiple inputs (conditional blocks and logic gates), as well as "switch statements" with multiple possible outcomes (branch gates).
- Use tables to store an array of values in rows and columns.
- Use summing gates to perform mathematical operations on multiple incoming values to determine a single output value.
- Control the flowchart path, including loops and other complex configurations, using flag markers and go-to-flag blocks, stop flags, counter blocks and reset blocks.
- Use result storage blocks to compute averages, sums, arrays, minimums/maximums and more.
- Use binary nodes to determine outcome probabilities.
- Describe any probability that can be constant or described by a statistical distribution.
- Use a simulation definition so that you can use one or more results from the simulation in the flowchart.
BlockSim results within Event Analysis flowcharts
Event Analysis flowcharts and BlockSim diagrams are directly integrated so you can work with both types of analyses together, and share many of the same resources. You have an option to use outputs from BlockSim RBDs or fault trees as inputs in your flowcharts. For example, if you have an analytical diagram that describes the reliability of a system, you can publish a model that will provide the system reliability when it is needed in any Event Analysis flowchart. Likewise, if you have a simulation diagram that estimates a system's operating cost, uptime, availability and other factors of interest, you can use the new simulation definition resource to draw any of these results into a flowchart.
Simulation Worksheets
You can investigate the effect of one or more settings on the simulation results, such as:
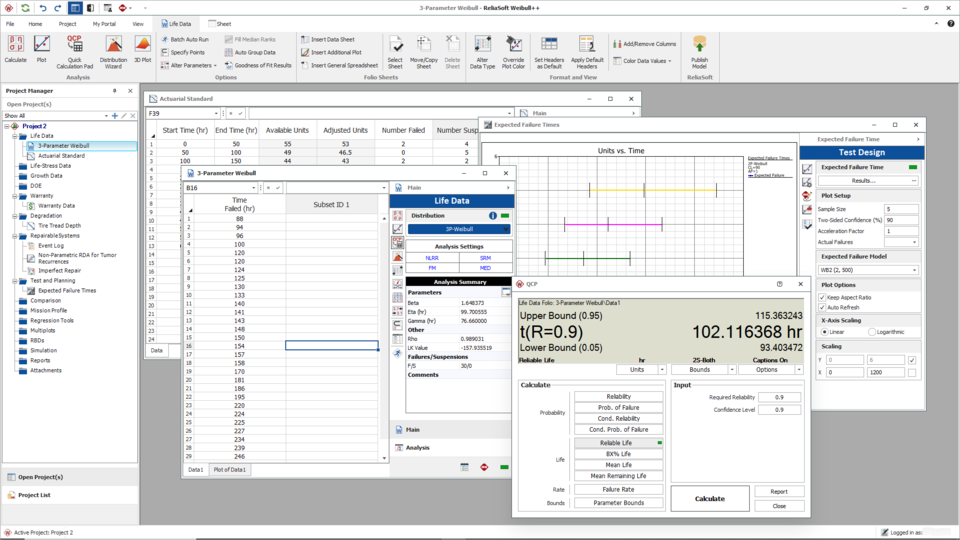
- Design an experiment in Weibull++—> simulate the experiment in Event Analysis module (BlockSim)—> then return to Weibull++ and analyse the simulated "response" data.
- Perform batch simulation of an RBD, using different input values for each simulation. For example, this tool makes it easy to run a set of simulations that compare a variety of possible scenarios by altering specific inputs for each simulation.
Diagram skins
Diagram skins allow you to maximise the visual impact and appeal of your flowcharts by applying a set of preferences for the colors, lines, text and images used. Choose from a variety of skins or create your own. Diagram skins are universal across all desktop applications. This means that a single skin can contain the appearance settings for all types of diagrams in BlockSim, Weibull++ and XFMEA/RCM++/RBI.
Intelligent features
Convenient color-coding
As you type, the module automatically color-codes recognized resources and functions to make it easy to spot potential problems.
Resource Preview
When editing an equation, it provides a quick summary of the properties of each resource or function. If you need more information or want to change a resource, you can open the full resource properties window with a click of a button.
Automatic conversion for time values entered in different units
You can define conversion factors for entering time values in different units.
Function selector and equation editor
Instant access to all of the building blocks that you will use in the equations for your analyses, which includes:
- Any of the user-defined resources available in the project
- Built-in internal functions to insert specific flowchart- or simulation-related information into an equation. The versatile getvalue functions can pull values from variables, tables or analysis workbooks and you can also use functions that obtain specific metrics from a given probability distribution.
- Any of the predefined functions including:
Debuger utility
This integrated utility can help you validate and "debug" your flowchart models, and it allows you to move through each step in a flowchart and watch the values as each block or resource is executed. You can also watch the progress during automatically performed number of simulations in "debug" mode.
Extensive potential applications
With Event Analysis module, you can create any flowchart model. Some of the most common include:
- Systems/product engineering and modeling
- Environmental systems modeling
- Hazardous waste sites, safety analysis
- Natural resource planning and management
- Business, financial and economic modeling
- Ecosystem modeling
Customisable results and plots
Once you have constructed a flowchart model that will explore the scenario of interest to you, the Event Analysis executes the model to generate desired results. This may include averages, sums, arrays, minimum values, maximum values, etc. For models without randomised values, a single execution will yield all results of interest. When randomised values are present, discrete event Monte Carlo simulation will be utilised.
- During simulation you can track the real-time values for a result of interest while the model is executed. Watch the result's progress over time or see how your results vary during sensitivity analysis.
- After simulation you can see final results directly in the flowchart. View the values for all result storage blocks, as well as the last values for other blocks, if desired. Plus, you can use Excel®-compatible spreadsheets to explore all applicable results, and to copy/paste or export results of interest to your reports or customised analyses.
- The Plot Setup allows you to completely customise the "look and feel" of plot graphics while the RS Draw metafile graphics editor provides the option to insert text, draw objects or mark particular points on plot graphics. You can save your plots in a variety of graphic file formats for use in other documents. You can also use interactive plot zoom.
Sensitivity analysis
This feature makes it easy to vary one or two variables across analyses/simulation runs. If you are analysing potential investment strategies, you may wish to vary the number of years that you will be investing and/or the percentage of your income that will be invested to see how different inputs will affect the final results. Likewise, you may wish to generate reliability or availability results for a range of times in order to examine the equipment’s behaviour over time.
Multiple analyses for optimum values
The Multiple Analyses feature takes the sensitivity analysis capability a step further by allowing you to automatically vary the specified variable(s) in order to determine the value that minimises or maximises a specified result. For example, you could use this feature to automatically determine the optimum amount of inventory to maximise profits or the optimum preventive maintenance (PM) interval to minimise costs. The results of each analysis can be displayed in the plot sheet, with the optimum value marked on the plot.
BlockSim for shared inputs and outputs
Flowcharts and diagrams are directly integrated in BlockSim. Now you can work with both types of analyses and share many of the same resources. You have an option to use outputs from RBDs or fault trees as inputs into flowcharts.