
ReliaSoft Weibull++
The industry standard for life data analysis
Ensure reliability, forecast warranty, and accelerate tests and reliability growth planning
ReliaSoft Weibull++ is a comprehensive life data analysis tool that performs life data analysis utilizing multiple lifetime distributions, warranty and degradation data analysis, design of experiment and more with a clear and intuitive interface geared toward reliability engineering.
Weibull++ can now be extended at an additional cost to include optionally licensed features for Accelerated Life Testing (formerly known as ALTA) and Reliability Growth (formerly known as RGA)
Discover What's New in ReliaSoft 2021 >
Benefits
- Compare suppliers or designs based on reliability.
- Use data-driven analysis to address today’s demanding performance specifications.
- Demonstrate that an item meets specified reliability.
- Make predictions about performance during the useful life (or warranty) period.
- Use plots and other reports to effectively communicate performance estimates to management.
Capabilities
- Complete (Failure Time)
- Right Censored (Suspension Time)
- Left Censored
- Interval Censored
- Free-Form
- Weibull
- Normal and Lognormal
- Exponential
- Gamma and Generalized Gamma
- Logistic and Loglogistic
- Gumbel
- Bayesian-Weibull
- Mixed Weibull
- Competing Failure Modes (CFM)
- Rank Regression on X (RRX)
- Rank Regression on Y (RRY)
- Maximum Likelihood Estimation (MLE)
- Non-Linear Rank Regression
- Fractional Failure Analysis
- Reliability demonstration test design: Determines the appropriate sample size, test duration or other variables for designing effective reliability tests and demonstration tests.
- Expected failure times plot: Displays times-to-failure that you may expect to observe for a given reliability life test.
- Difference detection matrix: Allows you to detect the difference between the reliabilities of two separate designs.
- Reliability or probability of failure
- Conditional reliability or conditional probability of failure
- Reliable life (i.e., time for a given reliability, also called “warranty time”)
- BX% life (i.e., time for a given unreliability)
- Mean life
- Failure rate
- Probability plots and pdf plots
- Contour plots
- Failure/suspension histograms, pie charts or timelines
- Overlay Plots (aka Multi-Plots)
- Side-by-Side Plots
- RS Draw® Metafile Graphics Editor
- 3D Plots
- Repairable System Analysis: Use the General Renewal Process (GRP) model or the Mean Cumulative Function (MCF) to analyze recurrent event data.
- Non-Parametric Life Data Analysis: Use Kaplan-Meier, Simple Actuarial or Standard Actuarial techniques when analyzing incomplete data that does not fit any life distribution in a satisfactory way.
- Event Log Folio: Use the specialized Event Log Folio to convert system failure and repair data into times-to-failure and times-to-repair.
- Monte Carlo simulation: Automatically perform analyses on simulated data sets in order to investigate confidence bounds, testing scenarios and help solve many other reliability engineering questions.
- Optimum replacement time calculation: The ability to calculate the optimum replacement time provides a powerful opportunity to reduce a system’s maintenance costs while maximizing uptime. The new Maintenance Planning Tool generates a cost vs. time plot designed to help you determine the most cost-effective time to replace a system’s worn or failed components. The tool also offers an option to create preventive and/or inspection tasks for use in BlockSim simulation diagrams.
- Non-Linear Equation Fit Solver: Estimates the parameters of any user-defined non-linear equation. This gives you the flexibility to perform simple parameter estimation on statistical models other than the life distributions and life-stress relationship models available in standard folios. After you have solved the equation, the tool provides a plot to visualize how the data fit the function, and also makes it easy to calculate Y for any given X value.
- Non-Linear Equation Root Finder: Quickly solves for the root of any user-defined non-linear equation. This helps you eliminate some of the guesswork of solving for the value of the unknown variable that makes the function be as close to zero as possible.
- Quick Parameter Estimator: Estimates the parameters of a statistical model based on what you know about the behavior over time. The software will “translate” your answers into the inputs required to obtain the model parameters.
- Quick Statistical Reference: Frees you from tedious lookups in tables by quickly returning results for commonly used statistical functions. Results include Median Ranks, Chi-Squared Values, Cumulative Binomial Probability, and many more. There is also a Polynomial Interpolation Function that allows you to enter known data points and then calculate Y for any given X value.
Life Data Types
Distributions and Parameter Estimation
The software provides a choice of all major lifetime distributions (including all forms of the Weibull distribution).
Parameter estimation options for standard life data analysis include:
Distribution Wizard and Ranking Methods
If you are not sure which model is appropriate for a given data set, the convenient Distribution Wizard automatically performs several types of goodness-of-fit tests (Kolmogorov-Smirnov, Correlation Coefficient, Likelihood value) in order to rank the available distributions.
The tool also comes with the ability to rank data points using Kaplan-Meier or Median Ranks.
Confidence Bounds
Weibull++ also provides confidence bounds for parameters, calculated results and plots. Depending on the specific analysis method used, the confidence bounds may be calculated using the Fisher Matrix, Likelihood Ratio, Beta Binomial or Bayesian (BSN) approach.
Reliability Test Design
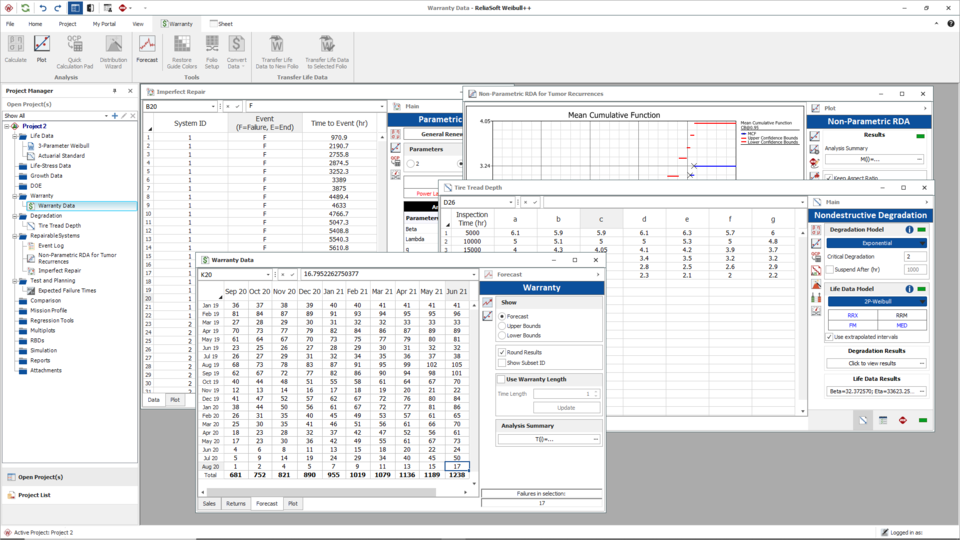
Warranty Data Analysis
A choice of data entry formats for using sales/returns data to perform life data analysis and make warranty projections: nevada chart, times-to-failure, dates of failure or usage (e.g., mileage, cycles, etc.).
Degradation Data Analysis
Use the linear, exponential, power, logarithmic, Gompertz or Lloyd-Lipow models to extrapolate the failure times of a product based on its performance (degradation) over a period of time. Weibull++ also includes destructive degradation analysis and the option to create user-defined degradation models.
Design Of Experiments (DOE)
Weibull++ supports a variety of experiment design types, including factorial and fractional designs, Taguchi robust designs, response surface method designs and DOE based on product life, called reliability DOE.
Reliability Block Diagrams
The built-in diagram feature allows you to create reliability block diagrams (RBDs) using blocks that are linked to analyzed Weibull++ folios. This feature can be used to analyze complex competing failure modes or simple system reliability. You can even send RBDs built in Weibull++ to BlockSim. This process exports the blocks into a new BlockSim simulation diagram, allowing you to perform further analyses such as system maintainability, availability and related analyses.
Life Data Results, Plots and Results
The Quick Calculation Pad (QCP) is a “Calculation Log” that allows you to record the results from a series of different calculations and then copy/paste the information as needed.
The software also provides a complete array of calculated results and plots based on the analysis. For life data analysis, this includes:
Weibull++ provides a complete array of advanced plotting tools. The Plot Setup allows you to completely customize the “look and feel” of plot graphics. You can save your plots in a variety of graphic file formats for use in other documents.
Customizable reports: The Synthesis Workbook is a custom reporting tool that is built into Weibull++. It seamlessly integrates spreadsheet and word processing capabilities while enabling you to include calculated results and plots from your analysis.
Additional Features
Discover key capabilities that make Weibull++ a powerful choice tool for life data analysis
Support decisions with life data analysis results
Easily input multiple types of life data, and use all major lifetime distributions to get results quicker with flexible plots and reports.
Ensure reliability within a specific time frame and confidence
Demonstrate that your product's reliability goals are met. Design effective reliability and demonstration tests with appropriate sample size, test duration, and more.
Predict future failures and detect outliers
Automatically perform analyses with the Weibull++ warranty analysis folio. Enter data in four different formats to find the answers you need.
Extrapolate failure times based on performance
Perform degradation data analysis and destructive degradation analysis with a variety of available models fit for your unique projects.
Gain deeper insights with design of experiments
Find the answers you need with a variety of experiment design types, such as DOE.
Analyse system reliability with complex competing failure modes
Create reliability block diagrams (RBDs), and link analyses to model your unique scenarios.
See All Functionality
Life data types, distributions and parameter estimation
Weibull++ supports all types of life data analysis, including:
- Complete (failure time)
- Right censored (suspension time)
- Left censored
- Interval censored
- Free-form
Parameter estimation options for standard life data analysis include:
- Rank Regression on X (RRX)
- Rank Regression on Y (RRY)
- Maximum Likelihood Estimation (MLE)
- Non-Linear Rank Regression
- Fractional Failure Analysis
All major lifetime distributions (including all forms of the Weibull distribution) are also supported:
- Weibull
- Normal and Lognormal
- Exponential
- Gamma and Generalized Gamma
- Logistic and Loglogistic
- Gumbel
- Bayesian-Weibull
- Mixed Weibull
- Competing Failure Modes (CFM)
Distribution wizard and ranking methods
If you are not sure, which model is appropriate for a given data set, the Distribution Wizard automatically performs several types of goodness-of-fit tests (Kolmogorov-Smirnov, Correlation Coefficient, Likelihood value) in order to rank the available distributions. It comes also with the ability to rank data points using Kaplan-Meier or Median Ranks.
Confidence bounds
Weibull++ provides confidence bounds for parameters, calculated results and plots. Depending on the specific analysis method used, the confidence bounds may be calculated using the Fisher Matrix, Likelihood Ratio, Beta Binomial or Bayesian (BSN) approach.
Reliability test design
Reliability demonstration test design determines the appropriate sample size, test duration or other variables for designing effective reliability tests and demonstration tests. Expected failure times plot displays times-to-failure that you may expect to observe for a given reliability life test.
Difference detection matrix allows you to detect the difference between the reliabilities of two separate designs.
Warranty data analysis
A choice of data entry formats available for using sales/returns data to perform life data analysis and make warranty projections: nevada chart, times-to-failure, dates of failure and usage (e.g., mileage, cycles, etc.), as well as the time.
Degradation data analysis
Use the linear, exponential, power, logarithmic, Gompertz or Lloyd-Lipow models to extrapolate the failure times of a product based on its performance (degradation) over a period of time. Weibull++ also includes destructive degradation analysis and the option to create user-defined degradation models.
Reliability block diagrams
The built-in diagram feature allows you to create reliability block diagrams (RBDs) using blocks that are linked to analyzed Weibull++ folios. This feature can be used to analyse complex competing failure modes or simple system reliability. You can even send RBDs built in Weibull++ to BlockSim. This process exports the blocks into a new BlockSim simulation diagram, allowing you to perform further analyses such as system maintainability, availability and related analyses.
Design of experiments (DOE)
Weibull++ supports a variety of experiment design types, including factorial and fractional designs, Taguchi robust designs, response surface method designs, and DOE based on product life, called reliability DOE.
Life data results, plots, and reports
The Quick Calculation Pad (QCP) is a "Calculation Log" that allows you to record the results from a series of different calculations and then copy/paste the information as needed.
The software also provides a complete array of calculated results and plots based on the analysis. For life data analysis, this includes:
- Reliability or probability of failure
- Conditional reliability or conditional probability of failure
- Reliable life (i.e., time for a given reliability, also called "warranty time")
- Probability plots and pdf plots
- Contour plots
- Failure/suspension histograms, pie charts or timelines
- BX% life (i.e., time for a given unreliability)
- Mean life
- Failure rate
Weibull++ provides a complete array of advanced plotting tools. The Plot Setup allows you to completely customize the "look and feel" of plot graphics. You can save your plots in a variety of graphic file formats for use in other documents.
- Overlay Plots (aka Multi-Plots)
- Side-by-Side Plots
- RS Draw® Metafile Graphics Editor
- 3D Plots
Customizable reports are also built into Weibull++. They seamlessly integrate spreadsheet and word processing capabilities while enabling you to include calculated results and plots from your analysis.
Related analyses and calculations
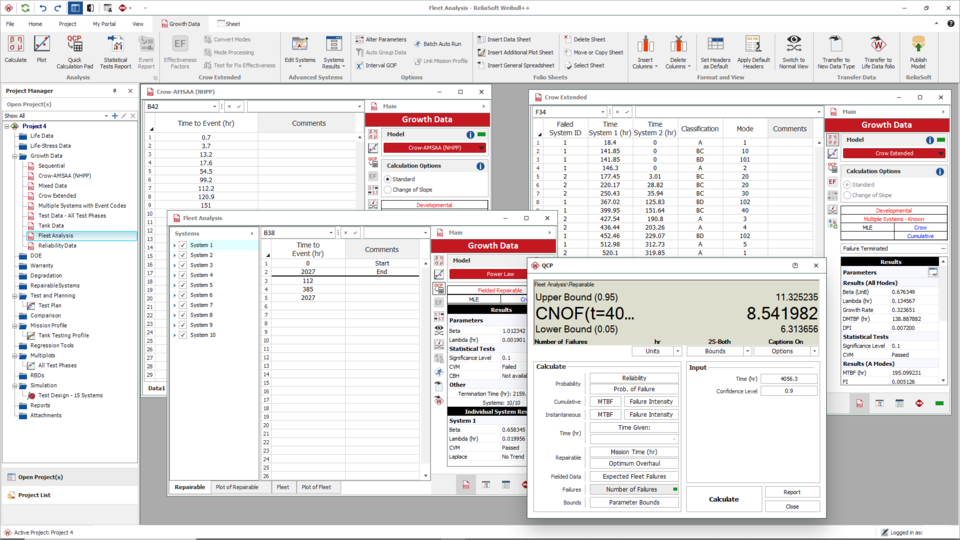
Repairable system analysis
Use the General Renewal Process (GRP) model or the Mean Cumulative Function (MCF) to analyze recurrent event data.
Non-Parametric Life Data Analysis
Use Kaplan-Meier, Simple Actuarial or Standard Actuarial techniques when analyzing incomplete data that does not fit any life distribution in a satisfactory way.
Event Log Folio
Use the specialized Event Log Folio to convert system failure and repair data into times-to-failure and times-to-repair.
Monte Carlo simulation
Automatically perform analyses on simulated data sets in order to investigate confidence bounds, testing scenarios and help solve many other reliability engineering questions.
Optimum replacement time calculation
It provides a powerful opportunity to reduce a system's maintenance costs while maximizing uptime. The new Maintenance Planning Tool generates a cost vs. time plot designed to help you determine the most cost-effective time to replace a system’s worn or failed components. The tool also offers an option to create preventive and/or inspection tasks for use in BlockSim’s simulation diagrams.
Non-Linear Equation Fit Solver
Estimates the parameters of any user-defined non-linear equation. This gives you the flexibility to perform simple parameter estimation on statistical models other than the life distributions and life-stress relationship models available in standard folios. After you have solved the equation, the tool provides a plot to visualize how the data fit the function, and also makes it easy to calculate Y for any given X value.
Non-Linear Equation Root Finder
Quickly solves for the root of any user-defined non-linear equation. This helps you eliminate some of the guesswork of solving for the value of the unknown variable that makes the function be as close to zero as possible.
Quick Parameter Estimator
Estimates the parameters of a statistical model based on what you know about the behavior over time. The software will "translate" your answers into the inputs required to obtain the model parameters.
Quick Statistical Reference
Frees you from tedious lookups in tables by quickly returning results for commonly used statistical functions. Results include Median Ranks, Chi-Squared Values, Cumulative Binomial Probability, and many more. There is also a Polynomial Interpolation Function that allows you to enter known data points and then calculate Y for any given X value.
Enhance your results and calculations with two Weibull++ modules
Design accelerated tests to achieve desired results
The Accelerated Life Testing module provides complete solution for accelerated test planning and quantitative accelerated life testing data analysis. Design accelerated life tests and calculate necessary reliability metrics to significantly reduce test times and lower development costs. With the most complex accelerated test data analyses and test plans available for multiple stress types, where stress is constant or varies by time, you will be able to produce more robust designs.
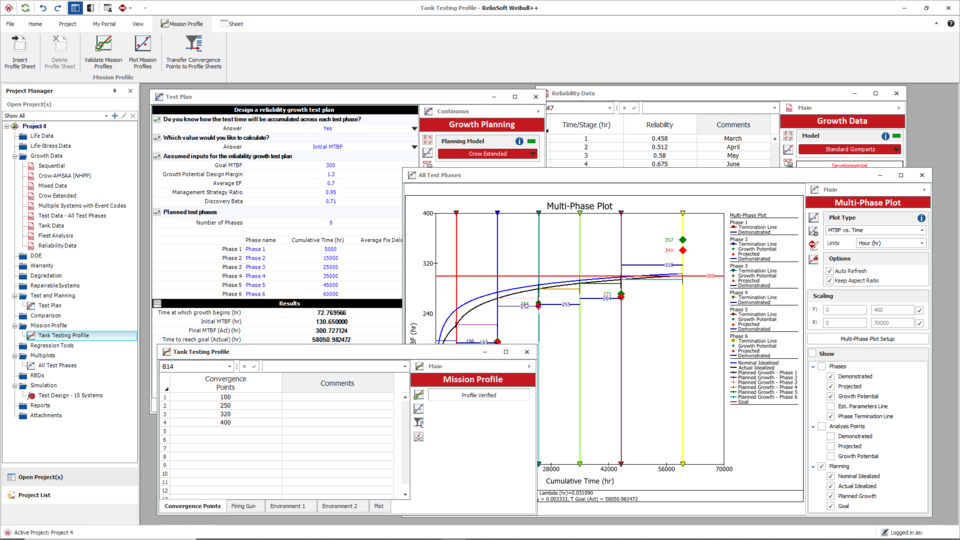
Improve reliability with the Reliability Growth module
Use reliability growth projections, reliability growth program planning and multi-phase reliability growth analysis to analyse data from both developmental testing and fielded repairable systems. Monitor reliability improvements over time and predict failures before they occur to evaluate the reliability growth management strategy. You can also quantify reliability growth across multiple test phases, design test plans for repairable systems and determine the test time required per system in order to demonstrate a specified reliability goal.