

ReliaSoft ALTA
ReliaSoft ALTA provides an intuitive and user-friendly way to utilize complex and powerful mathematical models for quantitative accelerated life testing data analysis. ALTA provides a comprehensive toolset for accelerated test planning and quantitative accelerated life testing data analysis, plots and reporting

The software is available in two versions and both provide a complete array of utilities for designing accelerated life tests, evaluating the fit of the model, calculating reliability metrics, generating plots and performing related statistical analyses.
ALTA software includes a full set of tools for experiment design and analysis (DOE) and provides the life-stress relationships required to analyze accelerated life test data with up to 8 simultaneous stress types, where stress is constant or varies with time.
- Quantitative Accelerated Life Testing (QALT) can help to significantly reduce test times and produce more robust designs.
- Analyze accelerated life test data with up to 8 simultaneous stress types, where stress is constant or varies with time.
- Flexible results, plots and automated reports to quickly provide the results, plots and reports you need to support decisions based on analysis results. Plots can be annotated and exported as graphic files for use in your reports and presentations. Automated report generation is also available.
- Complete array of QALT analysis capabilities, such as accelerated degradation analyses, accelerated life test plan, data analysis with the Weibull, lognormal and exponential distributions.
- Integration with nCode GlyphWorks for utilizing actual stress profiles.
- Supports a variety of experiment design types, including factorial and fractional designs, Taguchi robust designs, response surface method designs and reliability DOE
ReliaSoft Training >>
ReliaSoft Resources >>
Request a Trial >>
Benefits
- Understand and quantify the effects of stress or other factors on product life
- Design accelerated tests that will be the most effective to achieve desired objectives
- Significantly reduce the test time required to obtain reliability metrics for a product
- Faster time-to-market, lower product development costs and improved designs
Capabilities
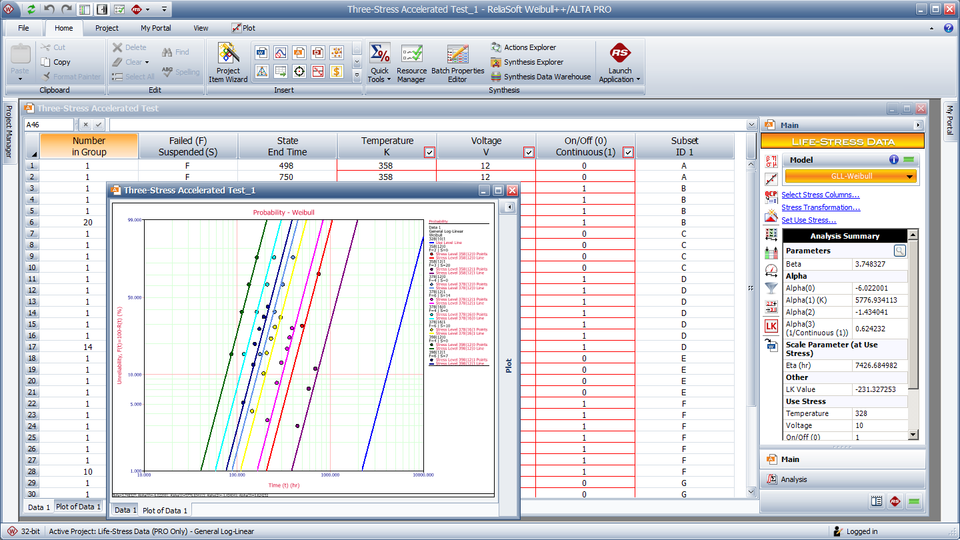
Accelerated Life Testing Plots and Results
The software provides a complete array of results and plots based on the analysis. For accelerated life testing data analysis, this includes:
- Reliability or probability of failure
- Conditional reliability or conditional probability of failure
- Reliable life (i.e., time for a given reliability, also called “warranty time”)
- BX% life (i.e., time for a given unreliability)
- Mean life
- Failure rate
- Acceleration factor
- Probability plots and pdf plots
- Life vs. stress, acceleration factor vs. stress, and standard deviation vs. stress plots
- Residuals plots
- Three-dimensional surface plots such as reliability vs. time vs. stress
Time-dependent Stress Profiles
The cumulative damage life-stress model can handle data from tests where the stress varies with time (e.g., a step-stress or ramp-stress profile). You can define and store any number of stress profiles, then easily assign the appropriate profile to each point in an ALTA data sheet. Each segment in a profile can be associated with a specific stress value or a time-dependent function. Additionally, ALTA includes Stress Profile Plots for each cumulative damage analysis that shows both the profile and the failures that occurred in each segment.
Related Analyses
Accelerated Non-Destructive Degradation Analysis: ALTA includes an accelerated non-destructive degradation analysis folio, which analyzes degradation data obtained from accelerated non-destructive tests. The result can be used to predict a product’s failure behavior under various use conditions.
Accelerated Destructive Degradation Analysis: ALTA includes an accelerated destructive degradation analysis folio, which analyzes degradation data obtained from accelerated tests that destroy the specimen or alter its subsequent performance. The result can be used to predict a product’s failure behavior under various use conditions.
Life Comparisons and Stress-Strength Analysis: The software provides two tools designed for statistical comparison of data sets. The Life Comparison tool allows you to compare two data sets to determine whether items from the first set will outlast those of the second. The Stress-Strength comparison tool uses the same statistical approach to determine the probability of failure based on the probability of a specified “stress” data set exceeding a specified “strength” data set.
Monte Carlo Simulation: Generate data sets that can be analyzed directly in a standard folio. You can also use the SimuMatic® utility to automatically perform a large number of reliability analyses on data sets that have been created via simulation. These simulated data sets and calculated results can be used to perform a wide variety of reliability tasks, such as:
- Experimenting with the influence of sample sizes and censoring schemes on analysis methods.
- Constructing simulation-based confidence bounds.
- Experimenting with confidence intervals for analyses performed with different distributions.
- Developing and evaluating test plans.
Design of Experiments (DOE): ALTA supports a variety of experiment design types, including factorial and fractional designs, Taguchi robust designs, response surface method designs and reliability DOE.
Function Wizard
You can select to combine these life-stress relationships with an underlying Weibull, Exponential or Lognormal life distribution. If you are not sure which is appropriate for a given data set, the convenient Distribution Wizard automatically performs multiple goodness-of-fit tests in order to rank the available distributions.
Quick Calculation Pad
QCP provides a “Calculation Log” that works like a paper roll in an adding machine, allowing you to record the results from a series of different calculations and then copy/paste the information as needed.
Quick Parameter Estimator (QPE)
The Quick Parameter Estimator allows you to estimate the parameters of a statistical model based on what you know about the behavior over time. You can estimate the parameters of the entire model, including both the life-stress relationship and the use-level life distribution.
Quick Statistical Reference
The Quick Statistical Reference frees you from tedious lookups in tables by quickly returning results for commonly used statistical functions. Results include Median Ranks, Chi-Squared Values, Cumulative Binomial Probability, and many more. There is also a Polynomial Interpolation Function that allows you to enter known data points and then calculate Y for any given X value.
Non-linear Equation Fit Solver and Root Finder
- The Non-Linear Equation Fit Solver allows you to estimate the parameters of any user-defined non-linear equation. This gives you the flexibility to perform simple parameter estimation on statistical models other than the life distributions and life-stress relationship models available in standard folios. After you have solved the equation, the tool provides a plot to visualize how the data fit the function, and also makes it easy to calculate Y for any given X value.
- The Non-Linear Equation Root Finder allows you to quickly solve for the root of any user-defined non-linear equation. This helps you eliminate some of the guesswork of solving for the value of the unknown variable that makes the function be as close to zero as possible.
Accelerated Life Testing Results, Plots and Reports
Automatic Time Units Conversion and Color-Coding for Data Entry: You can define conversion factors for entering time values in different units. You can enter test data into a standard folio as hours but then use the QCP to calculate the reliability for a year of operation. Color-coding aids assist with data entry and management. There is an immediate color change if you enter data in an incorrect format. You also have the option to color-code data points based on their data type or subset ID.
Linked or Attached Files: You can use the Links and Attachments feature to keep related information from external data files together with the rest of the analysis.
Visualize Your Analysis Results:
- Plot Setup allows you to completely customize the “look and feel” of plot graphics while the RS Draw metafile graphics editor provides the option to insert text, draw objects or mark particular points on plot graphics. You can save your plots in a variety of graphic file formats for use in other documents.
- Overlay Plots allow you to plot the results from multiple data sets together in the same plot. This can be an effective visual tool for many different applications, such as comparing different data sets or analysis methods (e.g., Design A vs. Design B or MLE) or demonstrating the effects of a design change (e.g., Before vs. After).
- Side-by-Side Plots utility allows you to view (and print) multiple plots for a given data set side-by-side. For example, you may want to show the probability, reliability, pdf and failure rate plots for a given analysis together in the same window. Alternatively, you may wish to compare the probability or pdf plots for a given data set when analyzed with different distributions/models.
- Interactive plot zoom and 3D plotting utility
Customizable reports: Workbooks seamlessly integrate spreadsheet and word processing capabilities while enabling you to include calculated results and plots from your analysis.
Integration with nCode GlyphWorks
You have the ability to import and process signals or time series data from nCode GlyphWorks .s3t files and subsequently utilize the post-process profiles in ALTA for reliability calculations.
Standard vs. PRO
ALTA provides full support for the analysis of data obtained from quantitative accelerated life tests. The software is available in two versions:
- ALTA Standard is intended to be an entry-level tool for the reliability professional interested in basic quantitative accelerated life testing data analysis applications.
- ALTA PRO provides advanced capabilities made possible by extensive research and development in complex quantitative accelerated life testing data analysis techniques.
What's New in Version 2019?
Version independent locator links
ReliaSoft Locator Links created in Version 2019 or later do not include the software version information as part of the link. When you open a link, the software will attempt to connect to the database, regardless of the database’s version. If you attempt to open a standard database that was created in an earlier version, the software will automatically convert it to the latest version. If you attempt to open an enterprise database that was created in an earlier version, the software will display a message; you must then upgrade the enterprise database to the later version.
Importing and exporting plot settings
Now in Version 2019 you have the option to import and export plot settings to an XML file. This allows you to define the settings for one plot and then use them in other plots.
Copy plot data
You can export the data from a plot to the Clipboard so that you can paste it into another application. The information depends on the plot type and on the application you are using.
Free-form (probit) data
Similar to the feature which only has been available in ReliaSoft Weibull++, the free-form data type is used to analyze the relationship between an independent variable (x-axis data) and the percentage of failures (y-axis data) in response to the variable. The y-axis data are treated as probability units, or probits, and they show how the percentage of failures increase in response to a variable (e.g., time, distance, stress level, etc.).
Transfer use level data
Now in Version 2019 you can create a free-form data sheet within the new ReliaSoft Weibull++ life data folio and copy the probability of failure over time values (Y-Axis Values) at the specified use stress levels (X-Axis values) into it.